
COVID-19, the climate crisis, loss of nature & biodiversity, pollution & waste, and rising inequalities are only a few of the crises we are currently facing. At this particular moment in history, we need to step up and do our best to address these challenges.
This section outlines the undeniable facts & data about climate change (updated periodically) to give you all you need to analyze the problem/s and find the most appropriate solutions.
Atmospheric carbon dioxide (CO2) levels are past 420 ppm and going up.
Earth’s temperature is going up as well, with 2023 being the warmest year on record.
The Science

Status of governments climate (in)action
#1
It’s true and it’s us
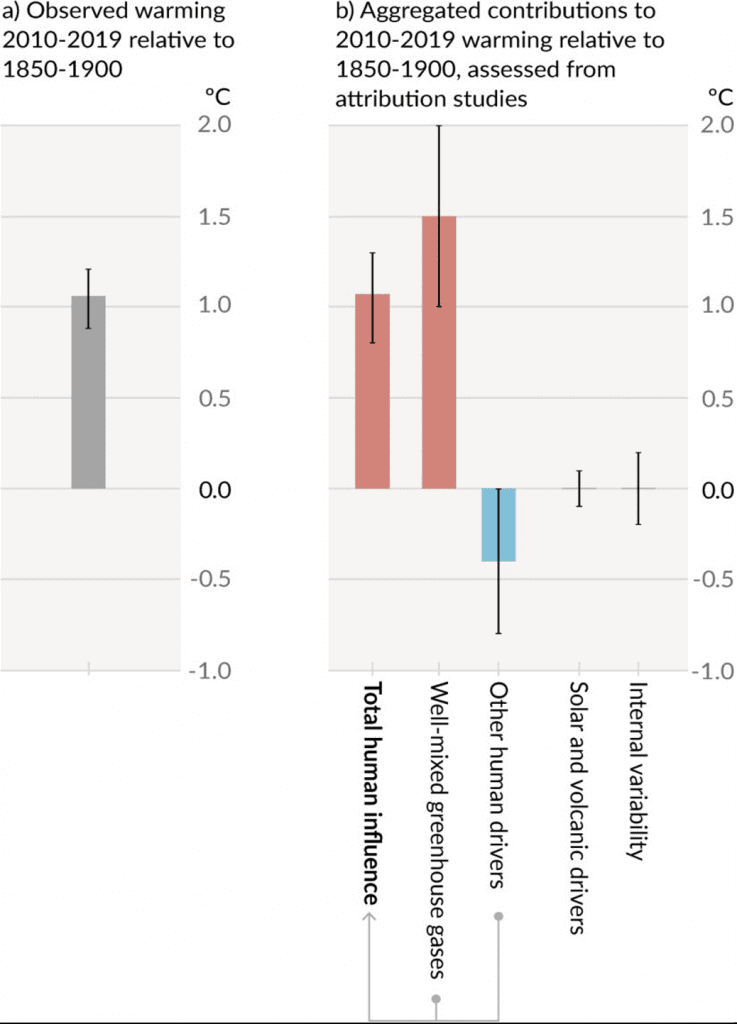
Observed warming is driven by emissions from human activities, with greenhouse gases warming partly masked by aerosol cooling.
#2
It’s unprecedented
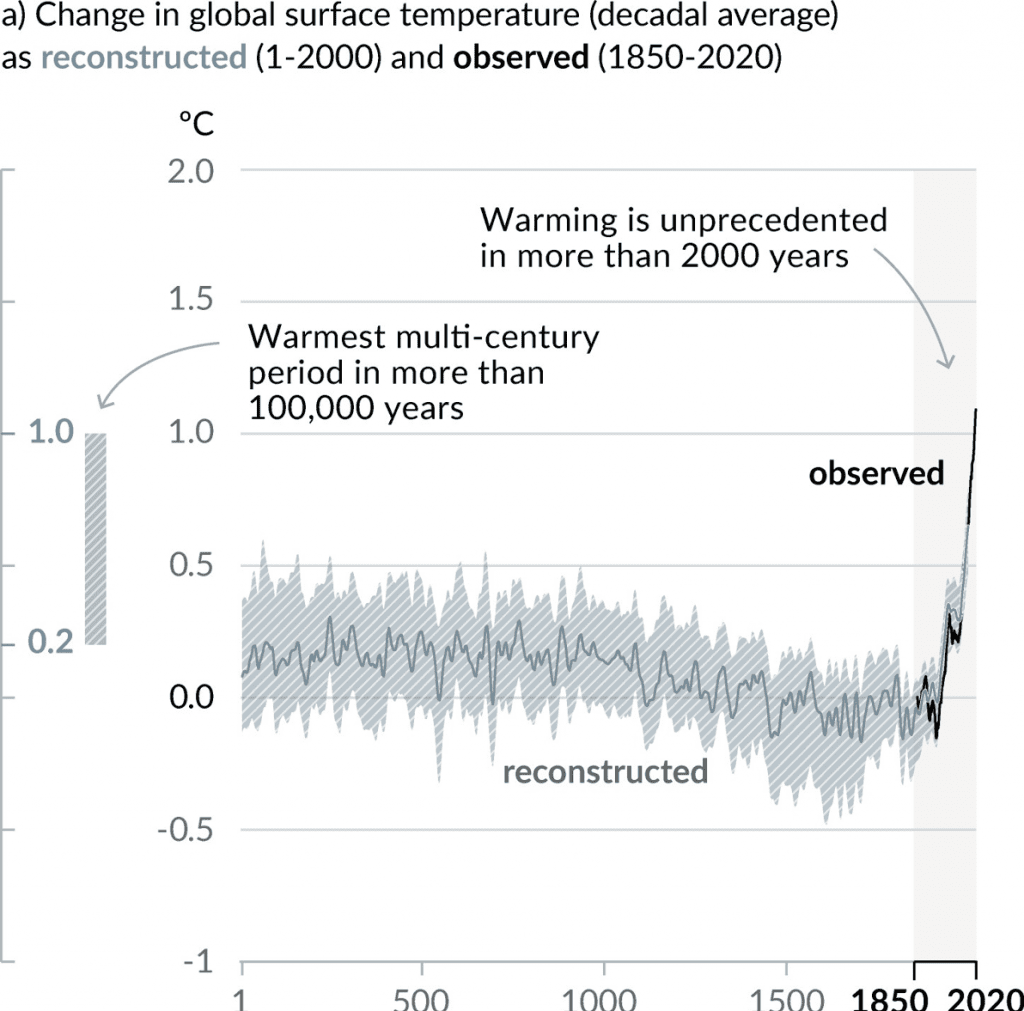
Human influence has warmed the climate at a rate that is unprecedented in at least the last 2000 years
#3
It’s our GHG emissions
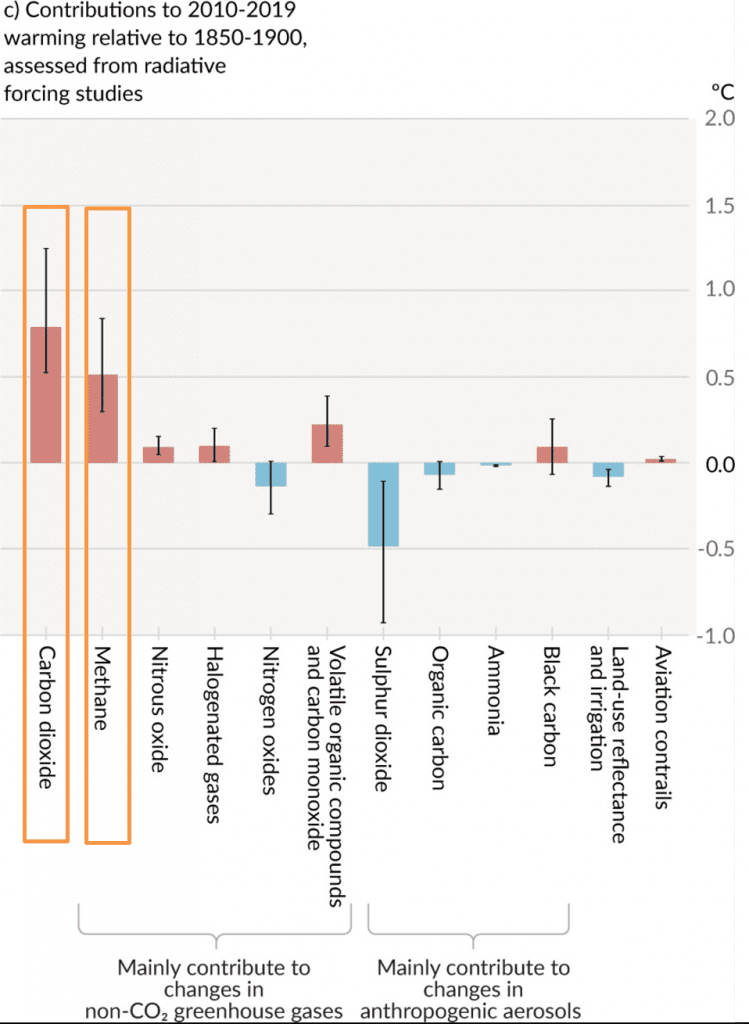
The chart shows different components of human influence, including emissions of greenhouse gases (GHGs), aerosols and their precursors; land-use changes; and aviation contrails. Carbon dioxide (CO2) main contributor followed by methane (CH4).
#4
Climate change is a threat to humanity
“The cumulative scientific evidence is unequivocal. Climate change is a threat to human well-being and planetary health. Any further delay in concerted anticipatory global action on adaptation and mitigation will miss a brief and rapidly closing window of opportunity to secure a liveable and sustainable future for all.”*
We need to recognize the urgency to act (both mitigation and adaptation).
*This is what you find on the last page of the report (p.35 Summary for PolicyMakers) released in February 2022.
#5
GHG emissions by gas
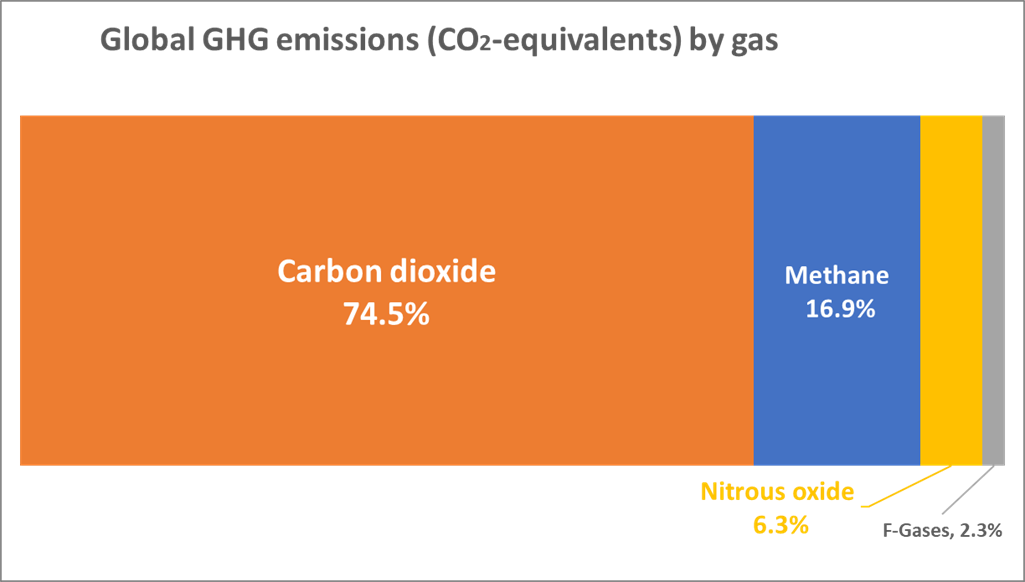
We collectively emit more than 50 billion tCO2-equivalents each year (48.9 GtCO2eq in 2018).
These emissions are the sum of different gases: carbon dioxide, methane, nitrous oxide, F-gases. Carbon dioxide was the main contributor with 74,5%, methane 16.9%, nitrous oxide 6.3%, F-gases 2.3%.
#6
Carbon Dioxide (CO2) emissions
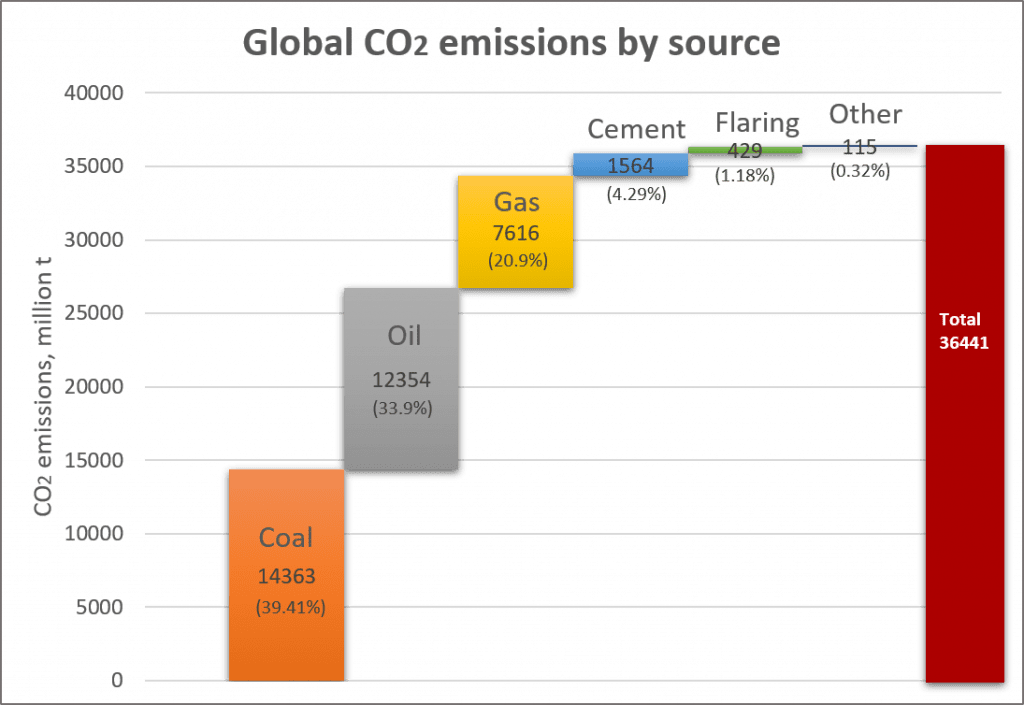
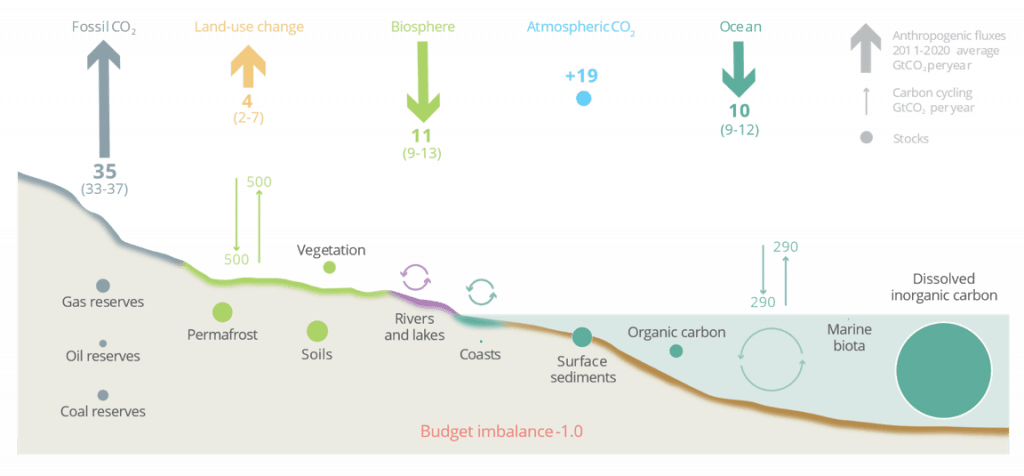
A total of 36.44 billion tCO2 in 2019 (36.42 in 2018) came from the burning of fossil fuels and cement production.
The majority of CO2 emissions came from burning coal (39.41%), oil (33.90%), and gas (20.9%). Emissions from cement production were 1.5 billion tCO2 (4.29%), and flaring 1.18%.
#7
Land-use change emissions
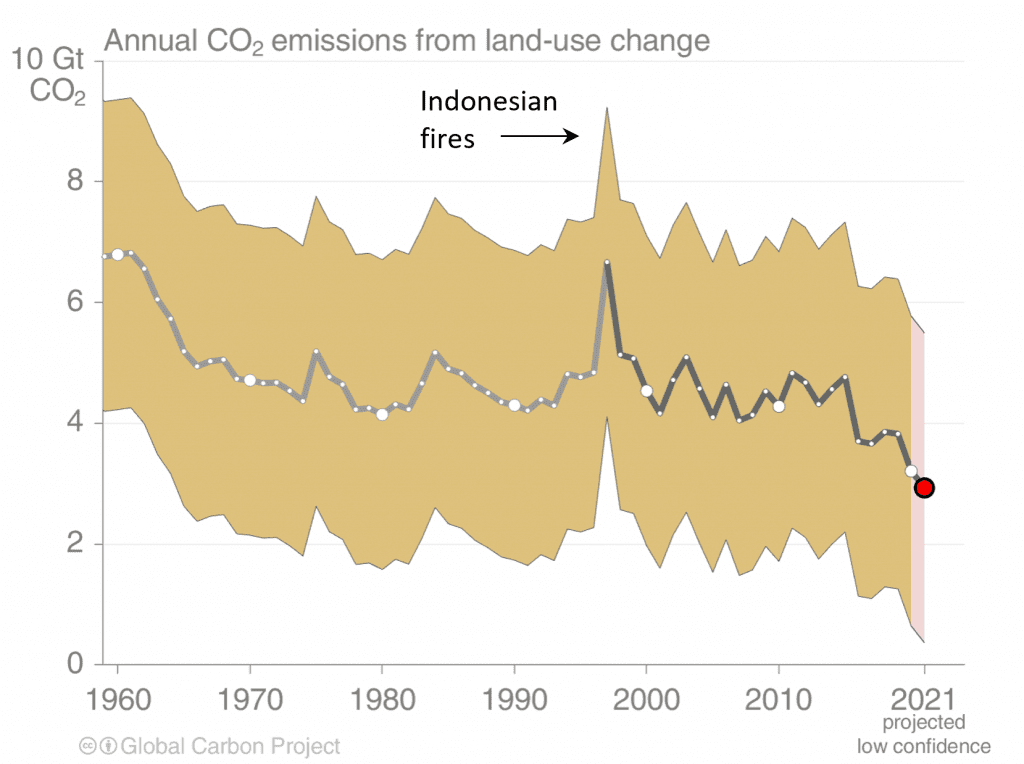
Land-use change emissions are 4.1 ± 2.6 GtCO2 for 2011-2020 and show a negative trend in the last two decades, but estimates are still highly uncertain.
#8
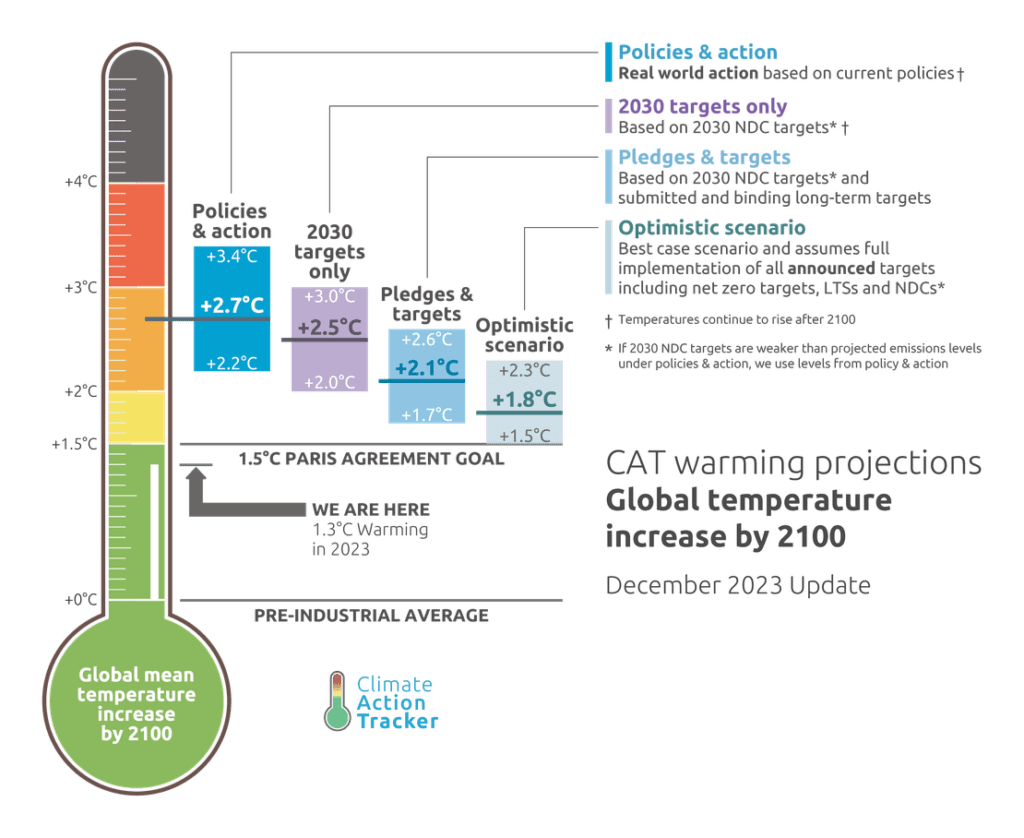
We will exceed 1.5C in the mid-term
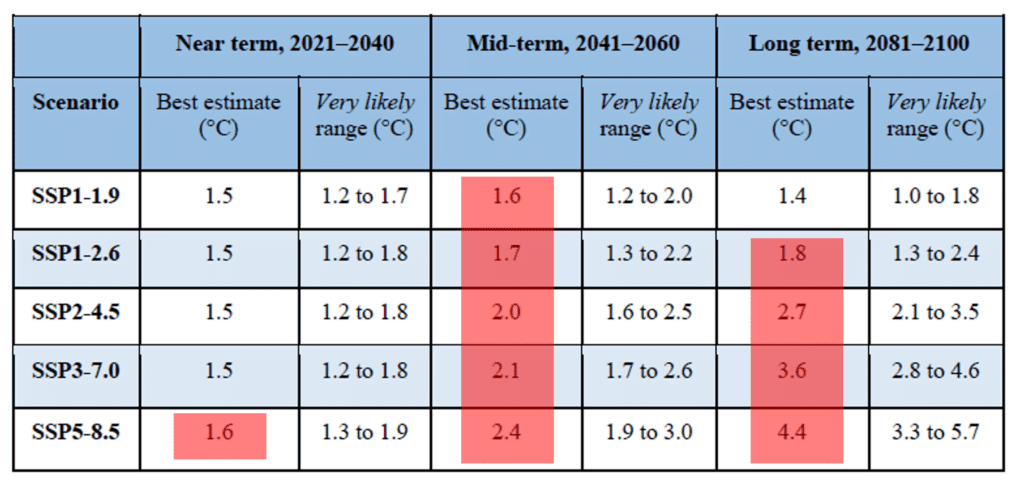
In all the five scenarios, we see that Earth’s temperature will rise above the 1.5C limit in the mid-term.
The good news is that as soon as emissions are cut to zero, temperature rise can stabilize in just three to five years (not decades). See #9
#9
Warming stops within a few years after stopping emissions
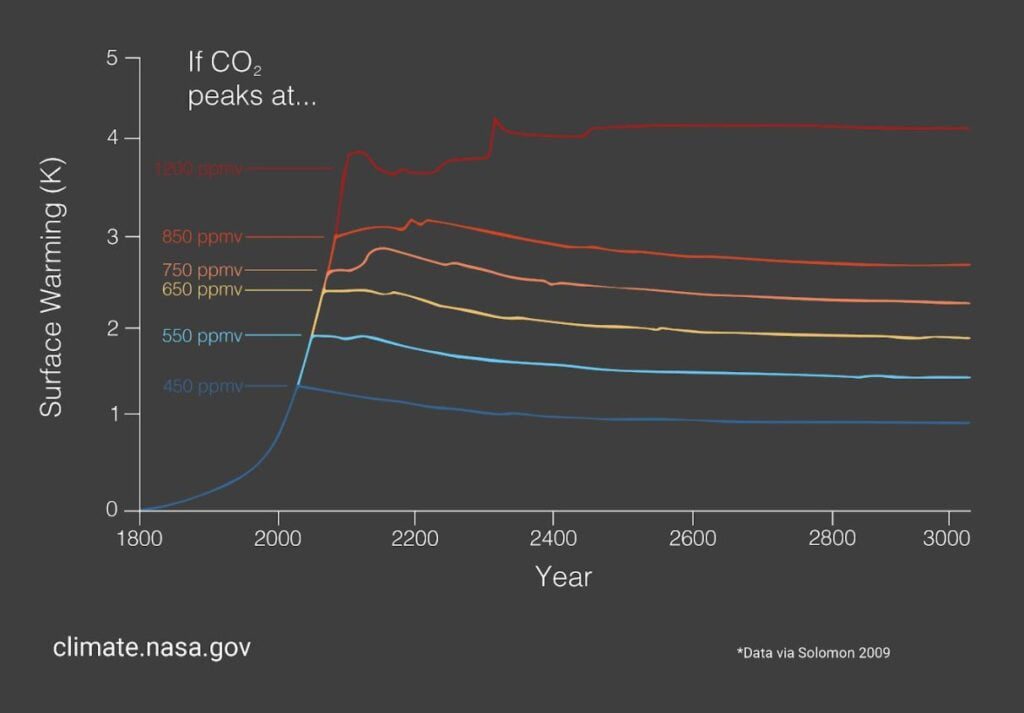
As soon as emissions stop, global warming stops within a few years.
Decades of research show that global warming is tied primarily to fossil fuel-derived greenhouse gas emissions, and when those stop, warming stops within a few years and remains flat for many many years.
This means that it is not too late to limit global warming, but we need rapid and sustained emissions cuts now.
#10
Every bit of warming counts
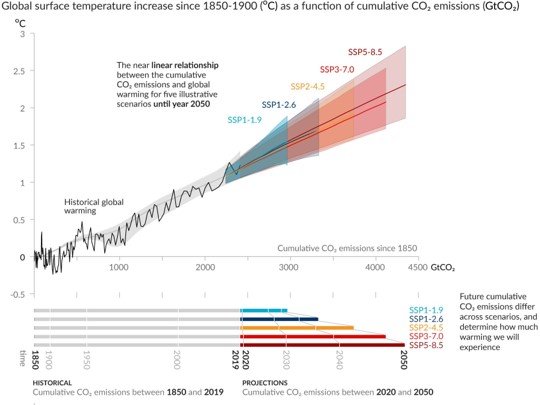
Every tonne of CO2 emissions adds to global warming.
There is a “near-linear relationship between cumulative anthropogenic CO2 emissions and the global warming they cause”. According to the IPCC report, every 1000 GtCO2 is assessed to cause a 0.45C (best estimate) increase in global surface temperature.
This means that our actions count. Every ton of CO2 not emitted is better than inaction.
#11
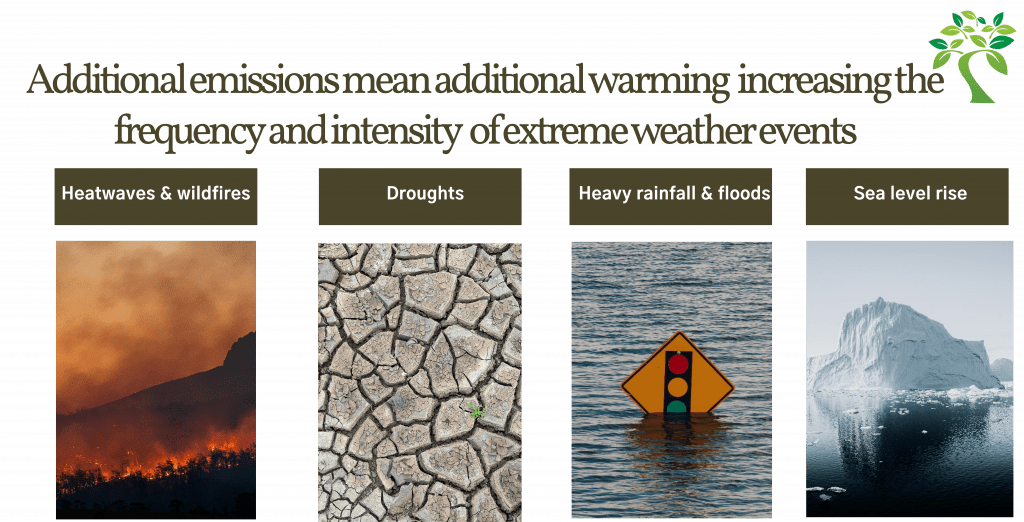
More emissions = more extreme weather
#12
We emitted for our “development”
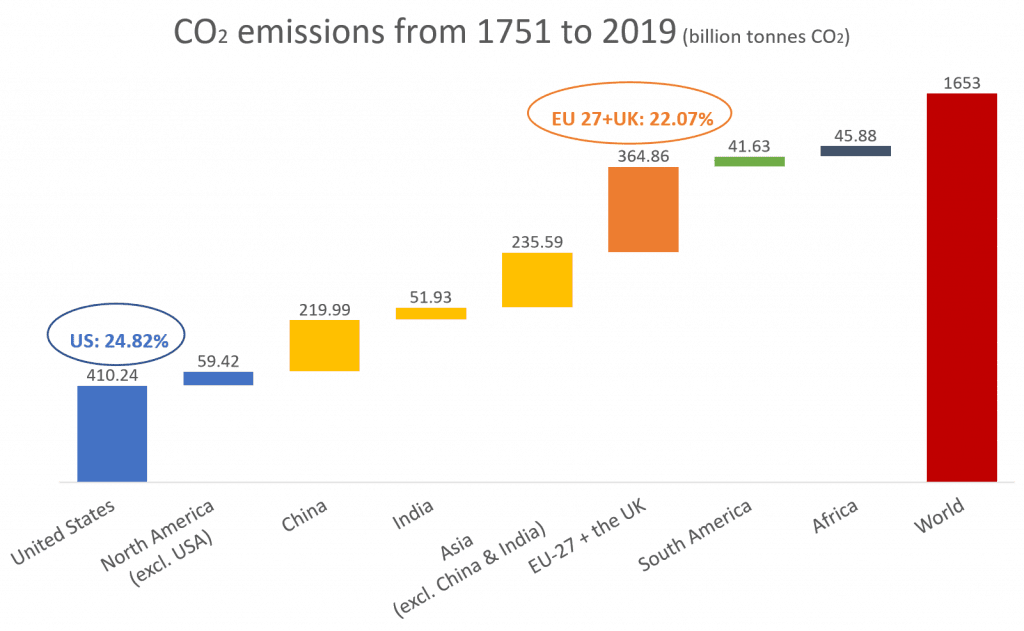
Cumulative CO2 emissions over the period 1751 to 2019 show that the wealthiest countries are responsible for most of the emissions already in the atmosphere.
#13
Tackling climate change = addressing inequalities
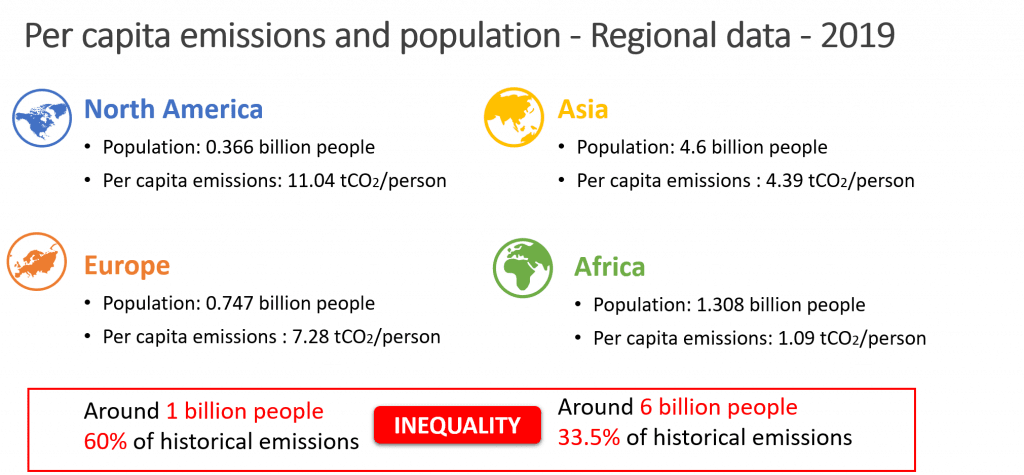
A compatible way exists: when we reduce this inequality by reducing (significantly) the emissions in wealthy countries and mobilizing climate finance for developing countries.
#14
GHG emissions by sector
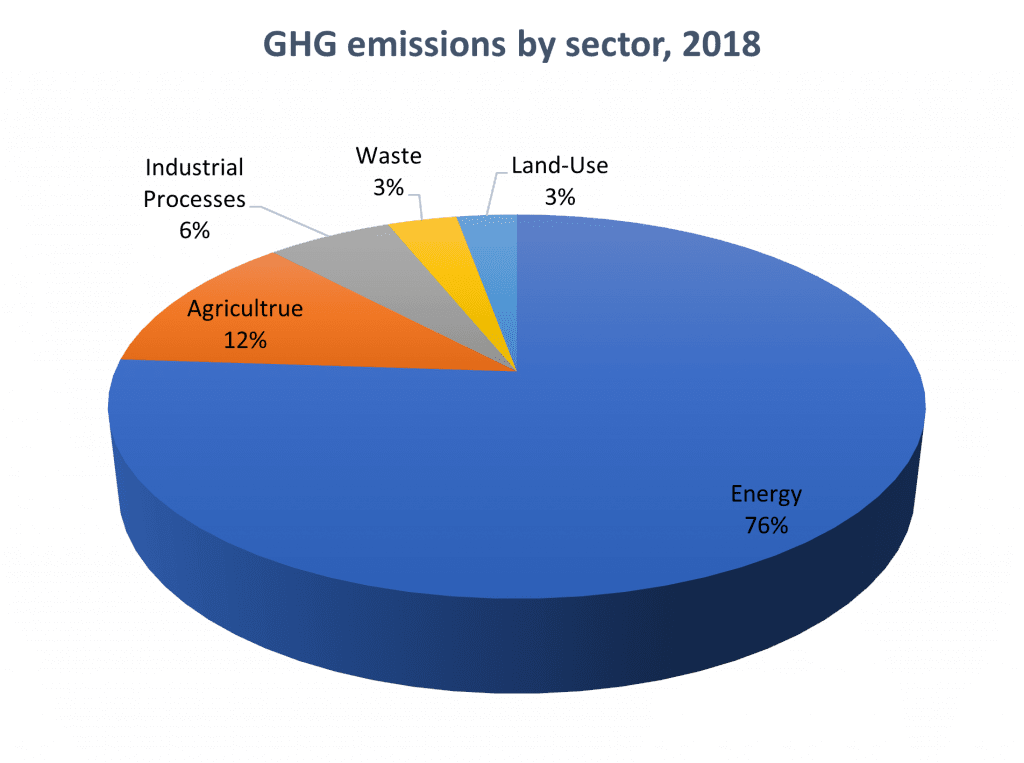
The energy sector is the biggest source of anthropogenic greenhouse gas emissions, responsible for 76% of the global GHG emissions.
Agriculture accounts for 12%; Industrial processes 6%(that is the CO2 produced as a byproduct in industrial processes, not from the energy used); waste about 3%, and land-use change and forestry another 3%.
#15
Where do we get our energy from?
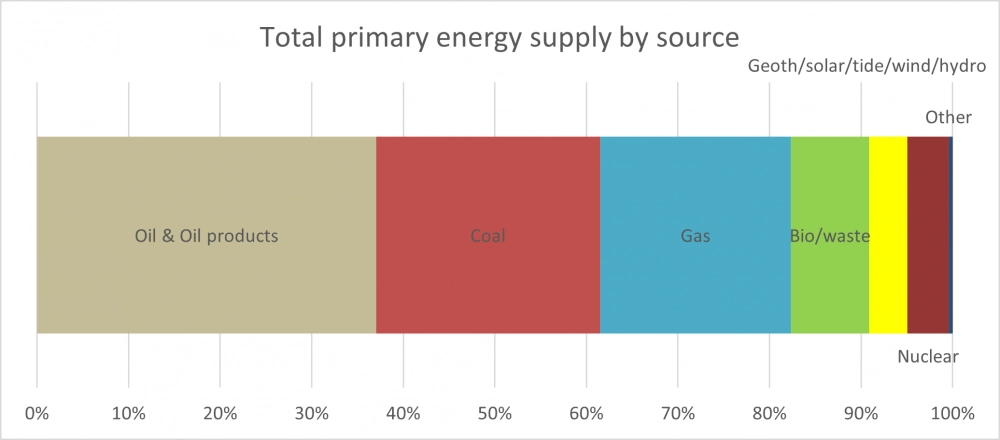
Globally we get the largest amount of energy from oil, followed by coal and gas.
Fossil fuels (oil, coal, and gas) made more than 80% of our total primary energy supply.
The burning of fossil fuels produces CO2 emissions (and global warming) see #6 above.
#16
Where do we use that energy
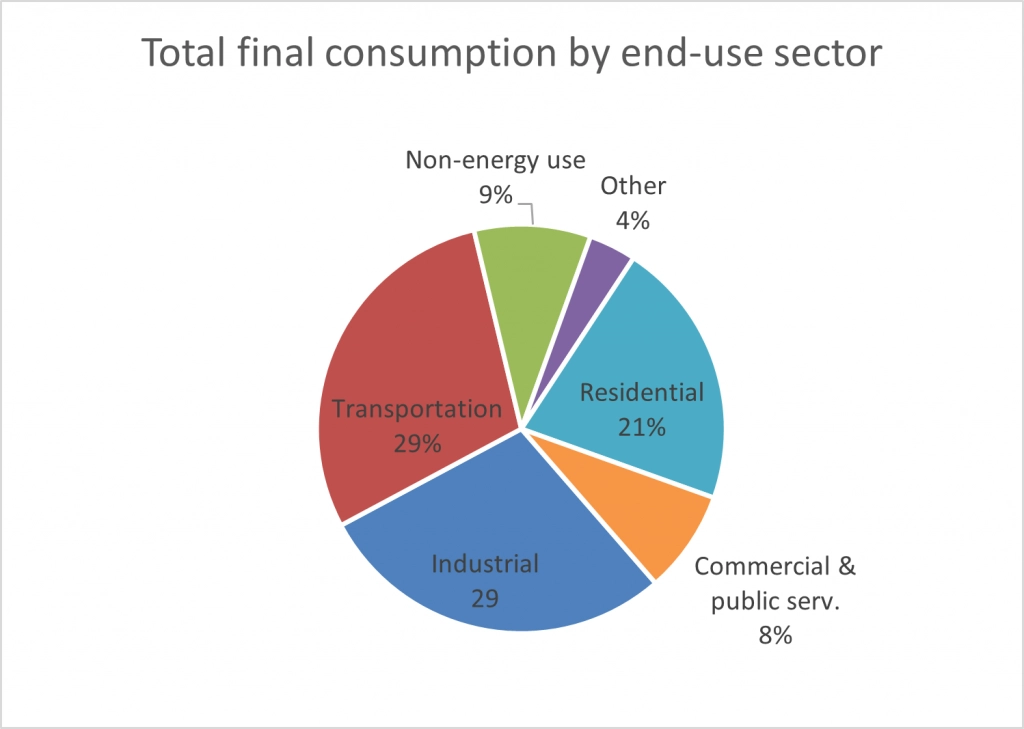
The chart shows the total energy consumption (worldwide). We used 29% in the transportation sector, another 29% in the industrial (this is the energy used in industry), and 21% in the residential sector. Combining residential & commercial, we get a 29%. It’s clear that we must act on all these sectors to reduce our emissions.
#17
Enregy consumption in the residential sector
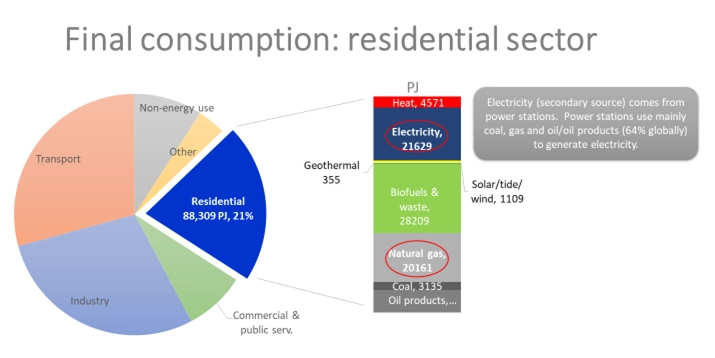
Globally, around half of the energy consumption in the residential sector – yes our houses/apartments – is used for electricity and natural gas (the sum of the two red circles).
Solutions: first, we need to decarbonize the electricity. We do this by adding more renewable energy sources to produce electricity. Second, we need to substitute natural gas consumption with electricity (e.g., electrifying our heating), and that electricity must be generated from renewable energy.
#18
CO2 emissions from transport
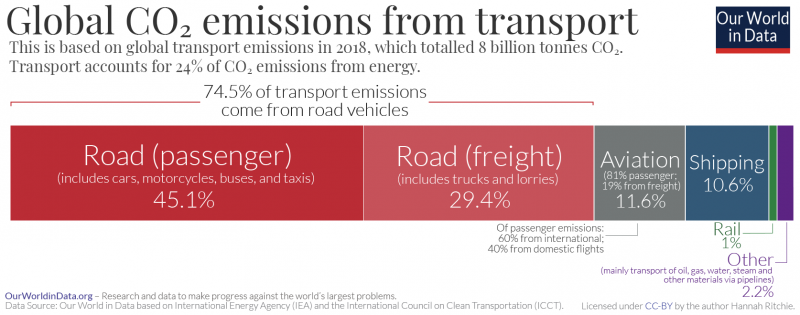
Road travel accounts for three-quarters of transport emissions. Most of this comes from passenger vehicles – cars and buses – which contribute 45.1%. The other 29.4% comes from trucks carrying freight.
Solutions: electrify our transportation (powered by renewable energy), use your bike more, walk.
#19
We are on a carbon budget
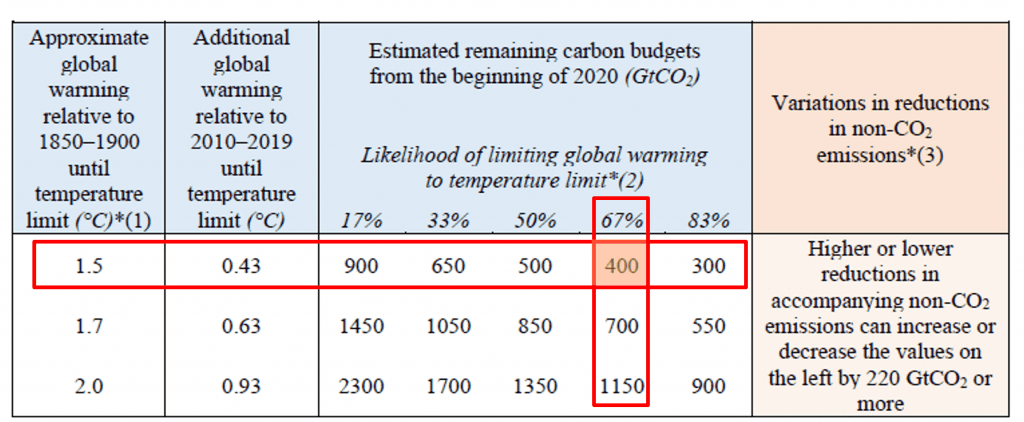
In the table, we see the IPCC estimates of remaining carbon budgets.
I have highlighted the estimated remaining carbon budget with a 67% likelihood of limiting the temperature under 1.5C (in red).
At the time of writing, the remaining carbon budget to keep warming below 1.5C will be gone in nine years, at current levels of emissions, according to the new Global Carbon Project.
#20
Anthropogenic perturbation of the global carbon cycle
#21
Land and ocean sinks
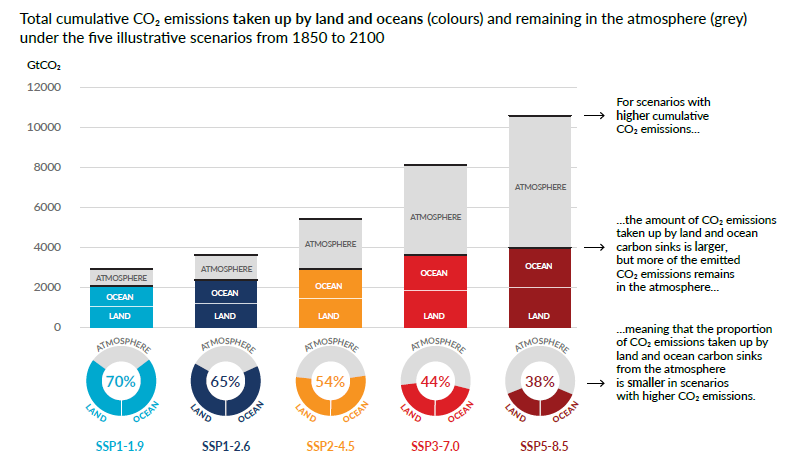
The proportion of CO₂ emissions taken up by land and ocean carbon sinks from the atmosphere is smaller in scenarios
with higher CO₂ emissions.
With increasing CO2 emissions, the ocean and land carbon sinks will be less effective at slowing the accumulation of CO2 in the atmosphere.