The fossil fuels in the world’s energy system
We use a lot of energy in our modern societies: to heat our houses, to produce electricity, to fuel our cars, and as input to many processes.
Energy supply
Today’s dominant source of energy is fossil fuels: oil, coal, and gas. We call fossil fuels “primary energy sources” (and they are non-renewable energy sources). Fossil fuel industries drill (or mine) these resources, but they can’t be used as found in nature. They are input to transformation processes, e.g., to produce electricity or refined to get fuels.
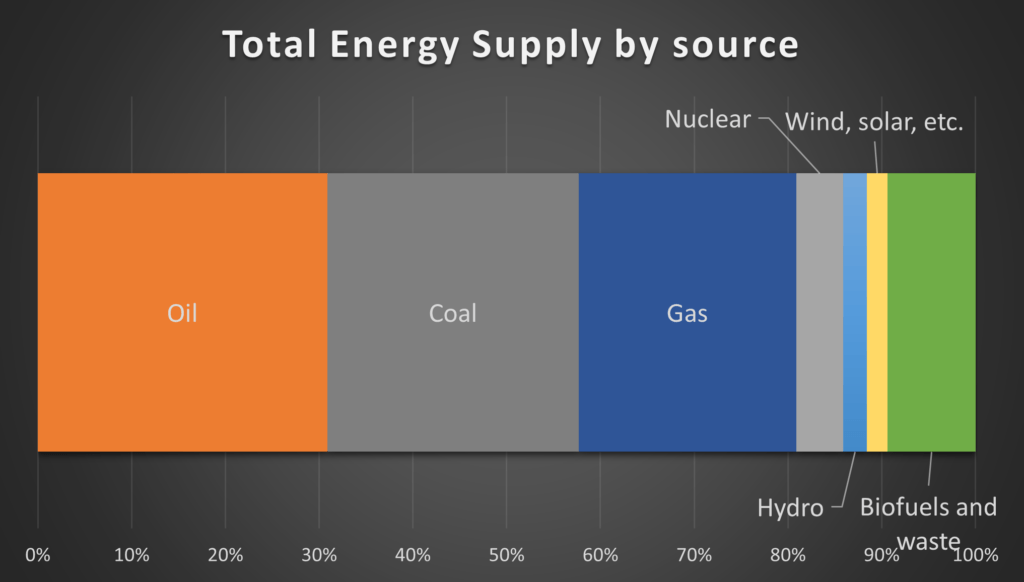
The chart shows that globally we get the largest amount of energy from oil, followed by coal and gas. Fossil fuels (oil, coal, and gas) make up more than 80% of our total energy supply. This is the energy we have at our disposal (before transformation processes).
Electricity generation
Electricity and energy are not the same.
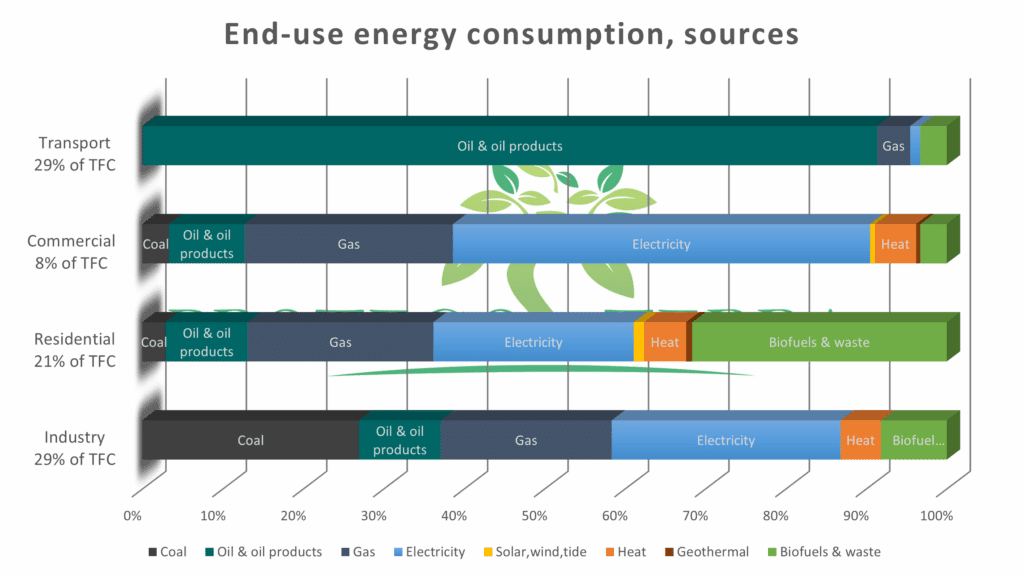
We have seen (above) that fossil fuels (primary energy sources) can’t be used as found in nature. As illustrated below, a big part of coal, part of gas, and some oil are sent to power stations to generate electricity.
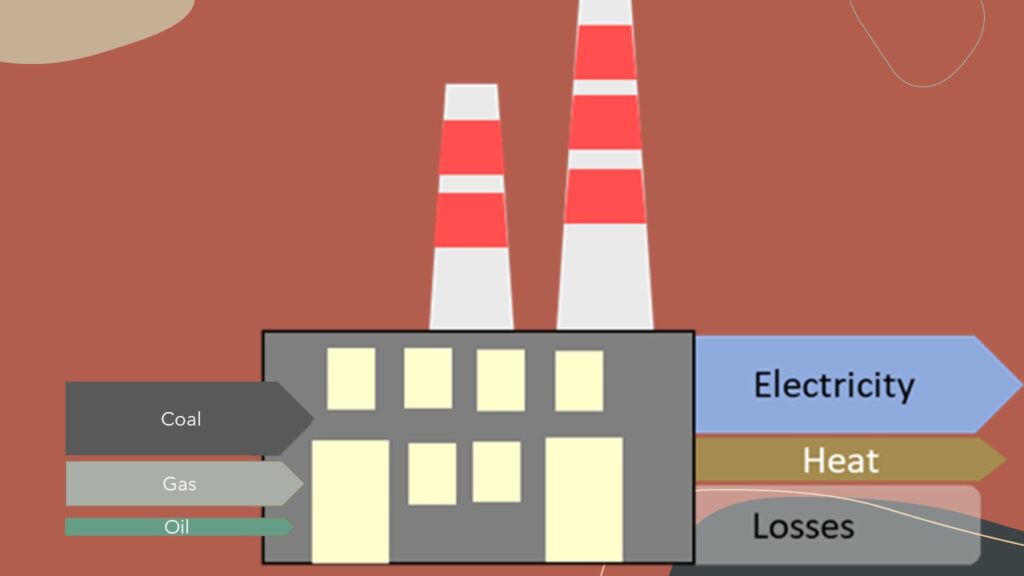
The electricity generated by power stations is called a secondary energy source because it is produced from primary energy sources.
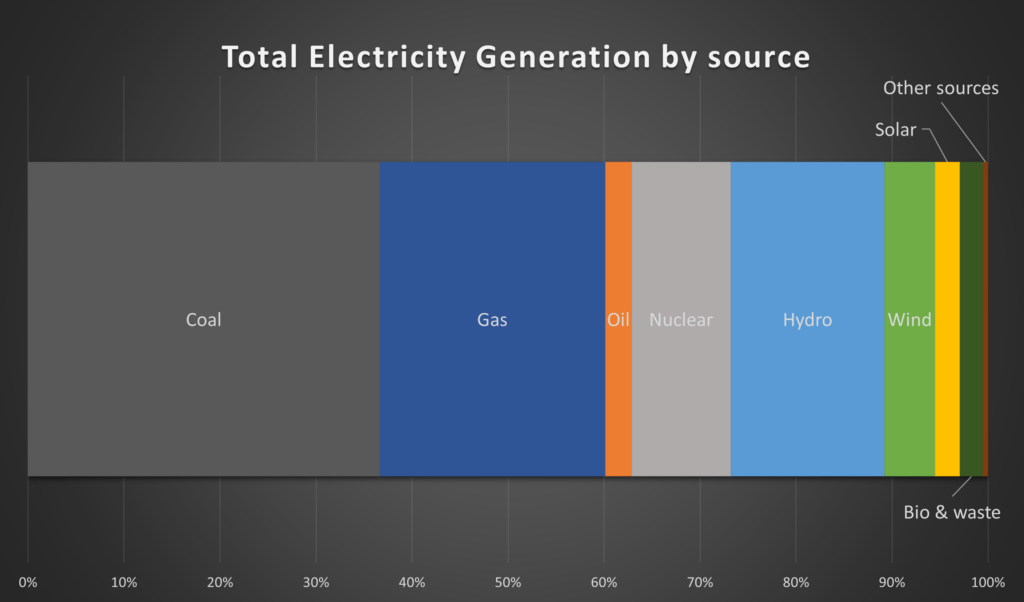
The electricity we globally generate (2019 IEA Data Statistics) comes mainly from coal (37%) and gas (23%)– fossil fuels add up to 63% of the generation (if we add 3% from oil). Another 10% comes from nuclear power. What about renewables? They are rising, and we have about 24% of our electricity generated by hydroelectric, wind, and solar.
Energy consumptions
After transformation processes (losses & exports if we follow the latest IEA Sankey diagram), we have what we globally consume 417,939 PJ – that is, our total final consumption. One petajoule is 1015 joules (one followed by 15 zeros – 1 million billion), so it’s a pretty big number. One petajoule is enough to cover the electricity used by 45,725 households in a year (considering the average home uses approx. 22 gigajoules of electricity in Australia in 2018/2019 – source energy.gov.au)
Energy is much more than electricity. Electricity and heat (secondary energy source as explained above) account for 23% of the energy we use, 40% is oil products and another 16% natural gas (2019 IEA data statistics).
Let’s have a look at where (the end-use sectors) we use all that energy (globally), analyzing our total final consumption (TFC).
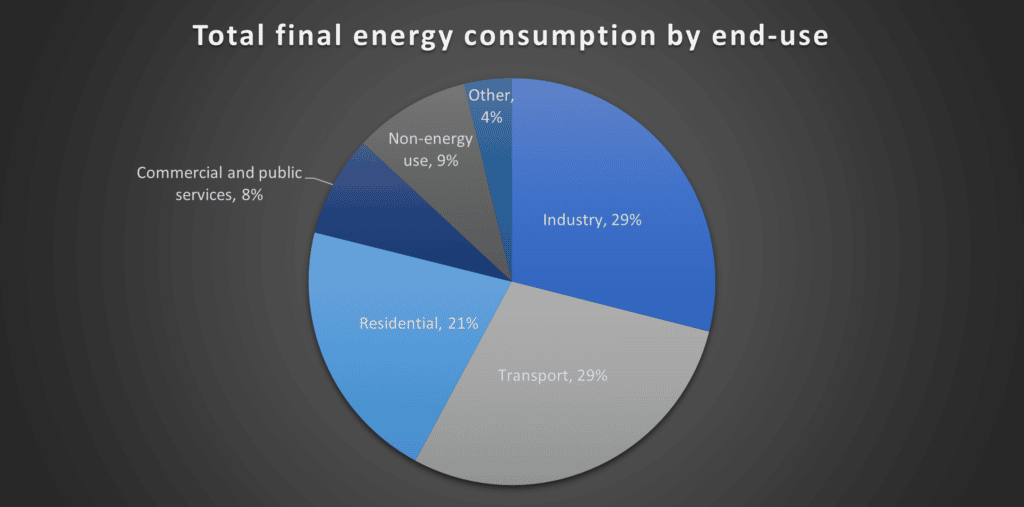
We can see that we used 29% in the transportation sector, another 29% in the industrial and 21% in the residential sector (e.g., houses, apartments). Combining residential & commercial (e.g., malls, schools, hospitals), we get a 29%.
Now let’s analyze each of the end-use sectors above to understand the significance of climate action measures.
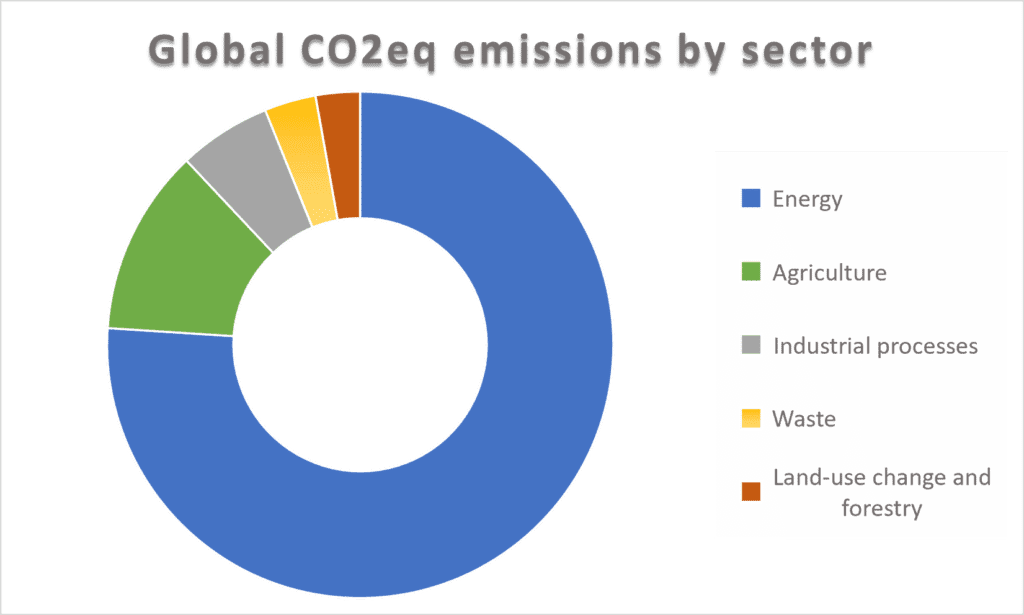
The energy sector’s CO2 emissions
When we burn fossil fuels to produce the energy we need, we also produce carbon dioxide (CO2) in an overall chemical reaction: CH2x+ (1+x/2) O2 ->CO2 + x H2O + heat. We would have (approx) x=2 for natural gas, x=1 for oil, and x=0.5 for coal. In addition, since N2 comes in with O2, we also have N2 molecules out. And heat (see chemical reaction).
We know that carbon dioxide is the main contributor to climate change. And the majority of CO2 comes from the energy sector, with the burning of fossil fuels. So let’s take a look at the IEA’s CO2 emissions data, where we can find the energy-related emissions.
Global emissions from the burning of fossil fuels (energy-related): latest ten years.
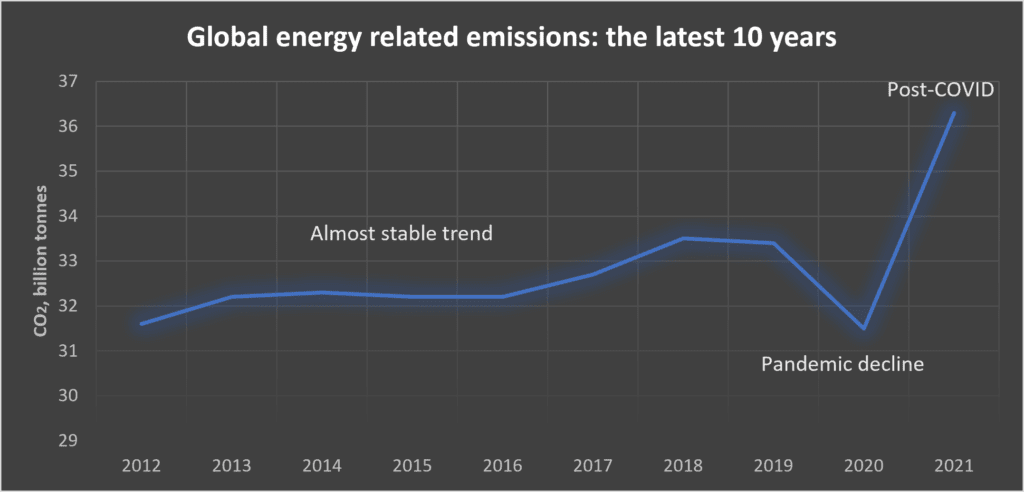
Here we can see that global energy-related CO2 emissions rose to 36.3 billion tonnes in 2021, their highest level (ever). It is clear that we are not transitioning towards a sustainable recovery. Was the global rebound in 2021 a one-off? Where is the “accelerated energy transition (n.d. that) contributes to global energy security and lower energy prices for consumers“?
If we want to thrive on this planet, we need to transition to sustainable energy. We will not solve the climate crisis if we don’t decarbonize the energy sector. We need to rapidly reduce the use of fossil fuels (coal, oil & gas) by displacing them with renewable energy sources.
The reality of CO2 emissions
The reality is that we are not doing what is needed. No reduction of CO2 emissions, not enough investments in adaptation. Not enough capital.
Is it too late?
NO. It is not too late to take action. Our efforts should concentrate on this: to unite to secure a peaceful and liveable planet. Let’s deploy the technologies we have and use all the nature-based solutions available (and yes, nature provides us with vital ecosystem services!).
Remember the big picture
Let’s remember that we collectively emit more than 50 billion tCO2eq: the energy sector is a good place to start with over 36 billion tCO2, but we need deep reductions across all sectors to have a chance at winning the climate crisis.