

![]()
![]()
Welcome back, readers! In this article, I analyze the cumulative emissions of CO2 by country, look at the latest data and reflect on one aspect that we, citizens of developed countries, often forget. That we are responsible for most of the emissions already in the atmosphere, and this is why it’s our time to lead and take responsibility to combat climate change.
Let’s start with the data.
The biggest emitters since 1751
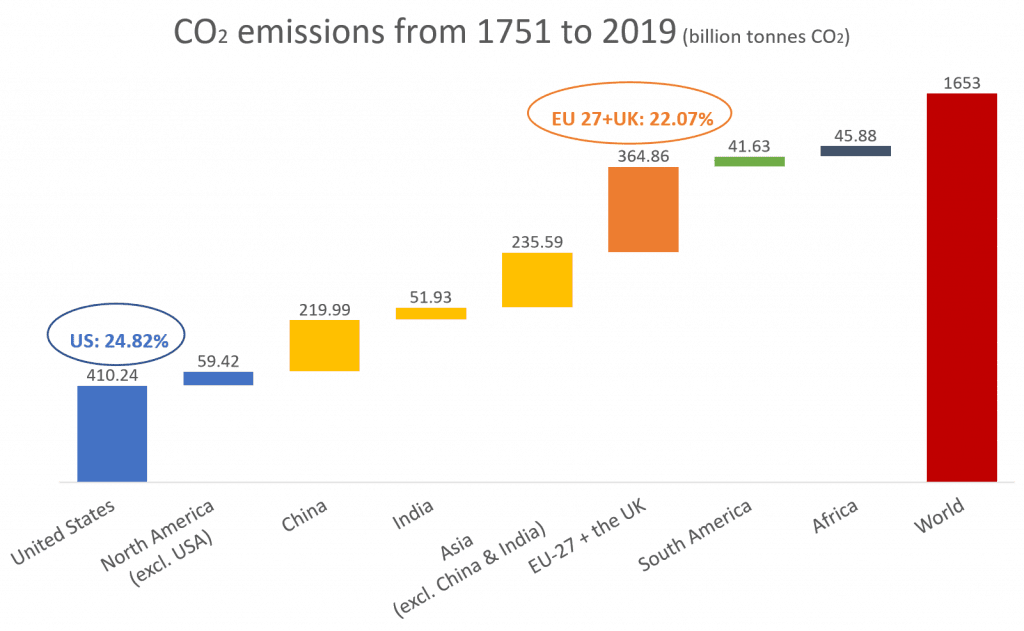
I prepared the graph below to show the countries that have contributed the most in terms of CO2 emissions (cumulative CO2 emissions) since the industrial revolution. Over the period from 1751 to 2019, we (humans) have emitted 1.65 trillion tonnes of carbon dioxide (from the burning of fossil fuels & cement production). This is a pretty big number.
The United States, as a national contributor, has emitted 24.82% the most, and the EU27 + the UK accounted for another 22.07%. Together, they sum up to 46.89% of the emissions. This is a huge amount.
Here the key points:
- The United States emitted more CO2 than any other country with 410 billion tCO2;
- China was the second-largest national emitter with about 220 billion tCO2 (half of the United States);
- the EU27 countries + the UK are significant historical contributors with c.a. 365 billion tCO2;
- We, in wealthy countries, are responsible for most of the emissions already in the atmosphere.
These emissions have contributed to what we have in our atmosphere. Earth’s natural carbon sinks (trees/soil and oceans) reduce CO2 emissions by around 50%, but this value changes in time. It will decrease with increasing CO2 concentrations. The point is that we cannot keep emitting at the same peace because the natural carbon sinks won’t be able to mitigate our emissions at the same rate they do for us today.
In May 2021, the measured atmospheric CO2 had a monthly average of 419 ppm (parts per million). And we have been experiencing the effects of global warming, with extreme weather events happening around the world.
So this is what we have done in the period 1751 to 2017. For our “development.” Now let’s have a look at just one year.
The biggest emitters in one year
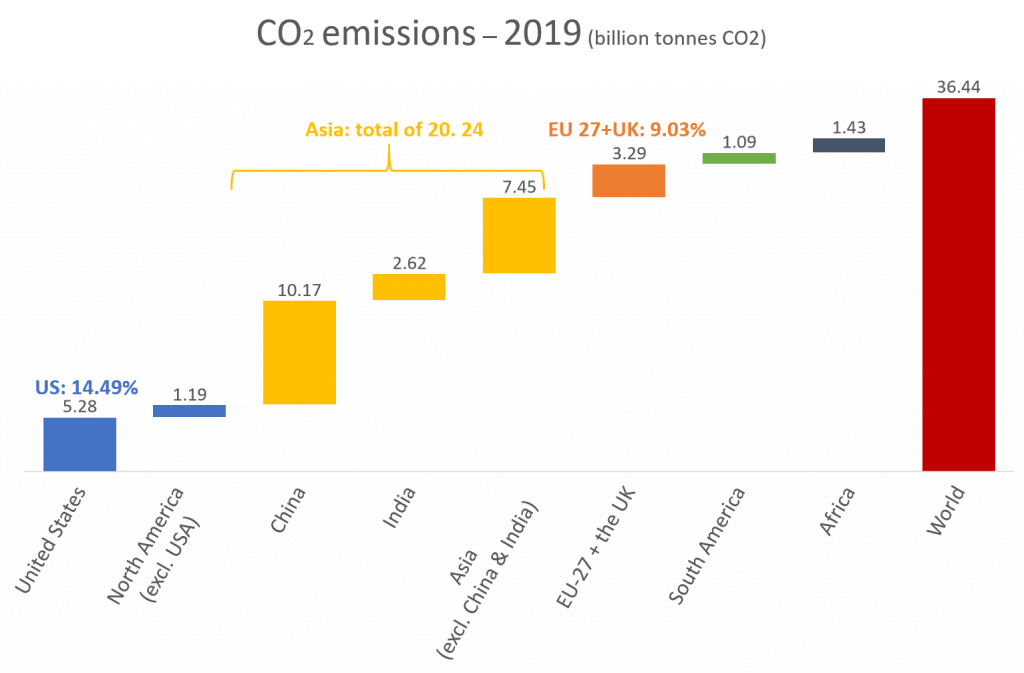
Now let’s look at the countries that emit the most in the last year analyzed (2019). I prepared another chart to show you how we can be biased when reading numbers isolated from the context.
Key points:
- China was the largest national emitter with 10.17 billion tonnes of CO2 in 2019, but if we look at the cumulative emissions (the first chart in the article), it represents only 13.3% since the industrial revolution;
- The United States emitted 5.28 billion tonnes of CO2 in 2019, but if we look at the cumulative emissions is the single highest contributor;
- the EU-27 countries + the UK accounted for 3.5 billion tonnes of CO2 in 2019, still a significant contributor.
When we look at these numbers, we see the growing consumption from developing countries, and we might be tempted to point fingers at developing Asia. However, we need one last figure in this analysis to understand why this is not the case.
However, we should consider one last point in this analysis. It is the carbon emissions per capita, how much CO2 the average person emits in a year.
Per capita carbon emissions
Let’s look at the image (below) I prepared using the same database used to make the charts above.
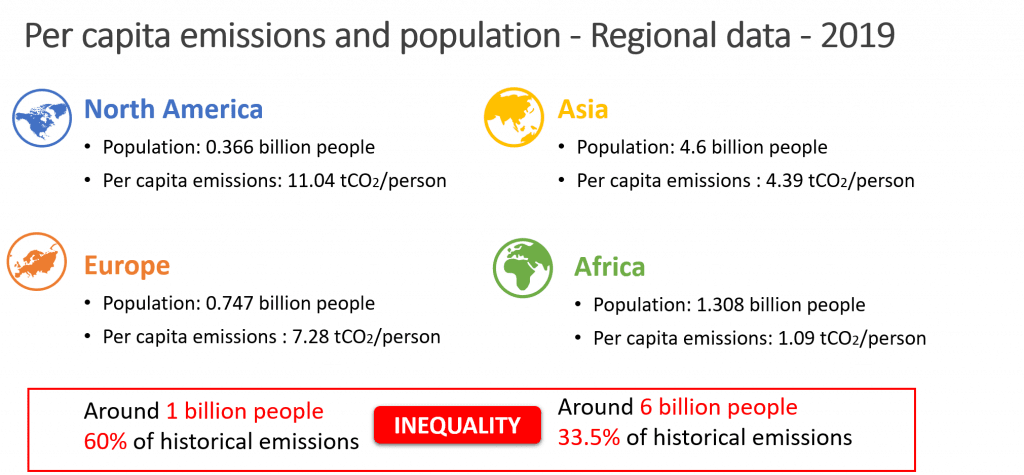
Now, imagine that each person in Asia emitted a 7.28 tCO2 (same as in Europe). This means that, since there are 4.6 billion people in Asia, they would emit 33.5 billion tonnes of CO2.
Asia alone would emit an amount of CO2 close to that we emitted in a year worldwide (that was 36.44 billion tonnes of CO2 in 2019).
Can we (in the wealthiest countries) afford not to help developing countries? No, we cannot because we have only one planet. The good news is that a compatible way exists: when we reduce this inequality by reducing (significantly) the emissions in wealthy countries and build trust with developing countries to cooperate and help them combat climate change by mobilizing climate finance.
We need a change of direction because we failed miserably. Twice.
- We pledged to raise $100 billion a year by 2020 to help them to cut greenhouse gas emissions and cope with the effects of climate change (extreme weather events).
And we failed to provide the money.
- COVID-19 hit the world, and yet the inequality we have seen in managing the pandemic – I mean in the access to vaccines, has been chilling.
We are about two months away from the crucial conference of parties (CoP26) in Glasgow. The most important thing in the forthcoming conference will be to re-establish that trust by setting bold (and binding commitments) and fulfilling our promises (e.g., to mobilize money for developing countries).
To the CoP26 participants: during the negotiations, keep in mind that we have only one planet, our common home. It’s our time to lead and take responsibility to combat climate change. Because we, in the wealthy countries, are responsible for most of the emissions already in the atmosphere.
To all of us (informed citizens): we must do our part (e.g., switching to renewable energy sources).
Thanks for reading!
If you enjoyed this article, subscribe to Protegoterra’s newsletter.